|
Ecological dimension - Ch. 6 of "Very short introduction"
View from India:
The Underlying
Causes of Environmental Degradation
Environmental
degradation is a result of the dynamic inter play of socio-economic, institutional
and technological activities. Environmental changes may be driven by many factors
including economic growth, population growth, urbanization, intensification of agriculture,
rising energy use and transportation. Poverty still remains a problem at the
root of several environmental problems.
Social Factors
Population
Population is an important source of development, yet it is a major source of environmental
degradation when it exceeds the threshold limits of the support systems. Unless
the relationship between the multiplying population and the life support system
can be stabilized, development programmes, howsoever, innovative are not likely
to yield desired results. Population impacts on the environment primarily through
the use of natural resources and production of wastes and is associated with environmental
stresses like loss of biodiversity, air and water pollution and increased
pressure on arable land.
India supports 17 per
cent of the world population on just 2.4 per cent of world land area. It’s
current rate of population growth at 1.85 per cent continues to pose a
persistent population challenge. In view of the linkages between population and
environment, a vigorous drive for population control need hardly be over emphasised.
Poverty
Poverty is said to be
both cause and effect of environmental degradation. The circular link between
poverty and environment is an extremely complex phenomenon. Inequality may
foster unsustainability because the poor, who rely on natural resources more
than the rich, deplete natural resources faster as they have no real prospects
of gaining access to other types of resources. Moreover, degraded environment
can accelerate the process of impoverishment, again because the poor depend directly
on natural assets. Although there has been a significant drop in the poverty
ratio in the country from 55 percent in 1973 to 36 percent in 1993-94 , the
absolute number of poor have, however, remained constant at around 320 million
over the years. An acceleration in poverty alleviation is imperative to break
this link between poverty and the environment.
Urbanisation
Lack of opportunities
for gainful employment in villages and the ecological stresses is leading to an
ever increasing movement of poor families to towns. Mega cities are emerging
and urban slums are expanding. There has been an eightfold increase in urban population
over 1901-1991. During the past two decades of 1971-91, India’s urban population
has doubled from 109 million to 218 million and is estimated to reach 300
million by 2000 AD. 42. Such rapid and unplanned expansion of cities has
resulted in degradation of urban environment. It has widened the gap between demand
and supply of infrastructural services such as energy, housing, transport, communication,
education, water supply and sewerage and recreational amenities, thus depleting
the precious environmental resource base of the cities. The result is the
growing trend in deterioration of air and water quality, generation of wastes,
the proliferation of slums and undesirable land use changes, all of which contribute
to urban poverty.
Economic Factors
To a large extent,
environmental degradation is the result of market failure, that is, the non-
existent or poorly functioning markets for environmental goods and services. In
this context, environmental degradation is a particular case of consumption or
production externalities reflected by divergence between private and social
costs (or benefits). Lack of well defined property rights may be one of the reasons
for such market failure. On the other hand, Market distortions created by price
controls and subsidies may aggravate the achievement of environmental objectives.
The level and pattern
of economic development also affect the nature of environmental problems. India's
development objectives have consistently emphasised the promotion of policies
and programmes for economic growth and social welfare. Between 1994-95 and
1997-98, the Indian economy has grown a little over 7 per cent per annum: the growth
of industrial production and manufacturing averaging higher at 8.4 per cent and
8.9 per cent respectively during these years. The manufacturing technology adopted
by most of the industries has placed a heavy load on environment especially
through intensive resource and energy use, as is evident in natural resource
depletion (fossil fuel, minerals, timber), water, air and land contamination,
health hazards and degradation of natural eco-systems. With high proportion
fossil fuel as the main source of industrial energy and major air polluting industries
such as iron and steel, fertilizers and cement growing, industrial sources have
contributed to a relatively high share in air pollution. Large quantities of
industrial and hazardous wastes brought about by expansion of chemical based
industry has compounded the wastes management problem with serious environmental
health implications.
Transport activities
have a wide variety of effects on the environment such as air pollution, noise
from road traffic and oil spills from marine shipping. Transport infrastructure
in India has expanded considerably in terms of network and services. Thus, road
transport accounts for a major share of air pollution load in cities such as Delhi.
Port and harbor projects mainly impact on sensitive coastal eco systems. Their construction
affects hydrology, surface water quality, fisheries, coral reefs and mangroves
to varying degrees.
Direct impacts of
agricultural development on the environment arise from farming activities which
contribute to soil erosion, land salination and loss of nutrients. The spread
of green revolution has been accompanied by over exploitation of land and water
resources, and use of fertilizers and pesticides have increased many fold.
Shifting cultivation has also been an important cause of land degradation.
Leaching from extensive use of pesticides and fertilizers is an important
source of contamination of water bodies. Intensive agriculture and irrigation contribute
to land degradation particularly salination, alkalization and water logging.
Institutional
Factors
The Ministry of
Environment & Forests (MOEF) in the Government is responsible for protection,
conservation and development of environment. The Ministry works in close collaboration
with other Ministries, State Governments, Pollution Control Boards and a number
of scientific and technical institutions , universities, non-Governmental
organisations etc.
Environment
(Protection) Act, 1986 is the key legislation governing environment management.
Other important legislations in the area include the Forest (Conservation) Act,
1980 and the Wildlife (Protection) Act, 1972. The weakness of the existing
system lies in the enforcement capabilities of environmental institutions, both
at the centre and the state. There is no effective coordination amongst various
Ministries/Institutions regarding integration of environmental concerns at the inception/planning
stage of the project. Current policies are also fragmented across several Government
agencies with differing policy mandates. Lack of trained personnel and comprehensive
database delay many projects. Most of the State Government institutions are relatively
small suffering from inadequacy of technical staff and resources. Although
overall quality of Environmental Impact Assessment (EIA) studies and the
effective implementation of the EIA process have improved over the years, institutional
strengthening measures such as training of key professionals and staffing with proper
technical persons are needed to make the EIA procedure a more effective
instrument for environment protection and sustainable development.
Example Water in China
Diminishing water supplies across the nation
-
China will have exploited all of its available water supplies by 2030, the government has warned. (Source: Buckley, Chris, “China says water supplies exploited by 2030,” Beijing Reuters, December 14, 2007.)
-
China’s per capita natural freshwater resources are expected to decline to 1,875 m3 by 2033, down from 2,156 m3 in 2007 (among the lowest per capita for a major country). 1,000m3 per capita is regarded the world water poverty mark. (Source: World Bank, “Addressing China’s Water Scarcity: Recommendations for Selected Water Resource Management Issues,” 2009.)
-
60% of China’s 660 cities are short of water. (Source: World Bank, “Addressing China’s Water Scarcity: Recommendations for Selected Water Resource Management Issues,” 2009.)
-
108 cities, including Beijing and Tianjin, face serious water shortages. Beijing has 230 m3 per capita of fresh water, far below the world water poverty mark. (Source: World Bank, “Addressing China’s Water Scarcity: Recommendations for Selected Water Resource Management Issues,” 2009.)
-
South China (the Yangtze River basin and areas
to its south) accounted for 80.4% of the nation’s naturally available
water resources but only 53.3% of the population, whereas Northern China
accounted for 19.6% of the water resources but 46.7% of the population
in 2000. (Source: World Bank, “Addressing China’s Water Scarcity: Recommendations for Selected Water Resource Management Issues,” 2009.)
-
In 2006, nearly half of China’s major cities did not meet provincial drinking-water quality standards (Source:
Organisation for Economic Cooperation and Development (OECD),
“Environmental Performance Review of China,” Paris, France, July 2007.)
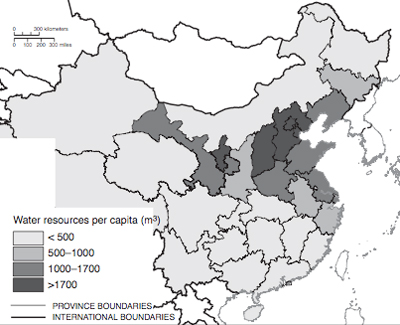
Water resources per capita
Source: World Bank, Addressing China’s Water Scarcity: Recommendations for
Selected Water Resource Management Issues, 2009.
Southern China
-
The Pearl River basin is faring better than many
of the other great river systems in China in terms of quality. Water
resources for the basin total 284 billion m3, allowing 2.383 m3 per capita. (Source: Civic Exchange, “Liquid Assets: Water Security and Management in the Pearl River Basin and Hong Kong,” December 2009.)
-
In 2007, a severe drought left well over a million people short of drinking water in southern China. (Source:
Gleick, Peter H., “The World’s Water 2008-2009: The Biennial Report on
Fresh Water Resources,” Island Press, December 2008.)
-
From October 2004 through January 2005, southern
China suffered from what local authorities described as the worst
drought in at least 50 years. The drought endangered the supply and
quality of drinking water for more than 15 million people in the Pearl
River Delta, Hong Kong, Hainan and elsewhere in the region. (Source:
USDA, Production Estimates and Crop Assessment Division Foreign
Agricultural Service, “Recent Rain Eases Drought in Southern China,”
2005.)
Northern China
-
In northern China, 45% of the water is
considered unfit for human consumption, compared to 10% in southern
China. For example, 80% of the rivers in the northern province of Shanxi
have been rated “unfit for human contact.” (Source: World Bank, “Addressing China’s Water Scarcity: Recommendations for Selected Water Resource Management Issues,” 2009.)
-
The annual per capita level of naturally available water resources in the Huang-Huai-Hai River basin area ranges from 358 m3 in the Hai-Luan basin to 750 m3 in the Huang, both being below the world water poverty mark. (Source: World Bank, “Addressing China’s Water Scarcity: Recommendations for Selected Water Resource Management Issues,” 2009.)
-
In the Hai River basin, where Beijing and
Tianjin are located, just 1.5% of China’s water resources are available
to support 10% (130 million people) of the total population. (Source: World Bank, “Addressing China’s Water Scarcity: Recommendations for Selected Water Resource Management Issues,” 2009.)
-
The annual sustainable supply of groundwater in the Hai River basin is estimated at about 17.3 km3 (17.3 billion m3), while withdrawals were 26.1 km3 (26.1 billion m3). This indicates an annual over-extraction of 8.8 km3 (8.8 billion m3). (Source: World Bank, “Addressing China’s Water Scarcity: Recommendations for Selected Water Resource Management Issues,” 2009.)
-
It is estimated that over 80% of the wetlands in
the North China Plain have been lost, and natural streams and creeks
have dried up as a result of groundwater and surface water overdrafts. (Source:
Gleick, Peter H., “The World’s Water 2008-2009: The Biennial Report on
Fresh Water Resources,” Island Press, December 2008.)
Again: Is Globalisation something new, a new quality in the development, or just an intensification of a process of many centuries?
|